
The Vortex: APOE4 Hyperexcitability and Membrane Lipid Biology
A Guide to Reading the The Vortex Diagram

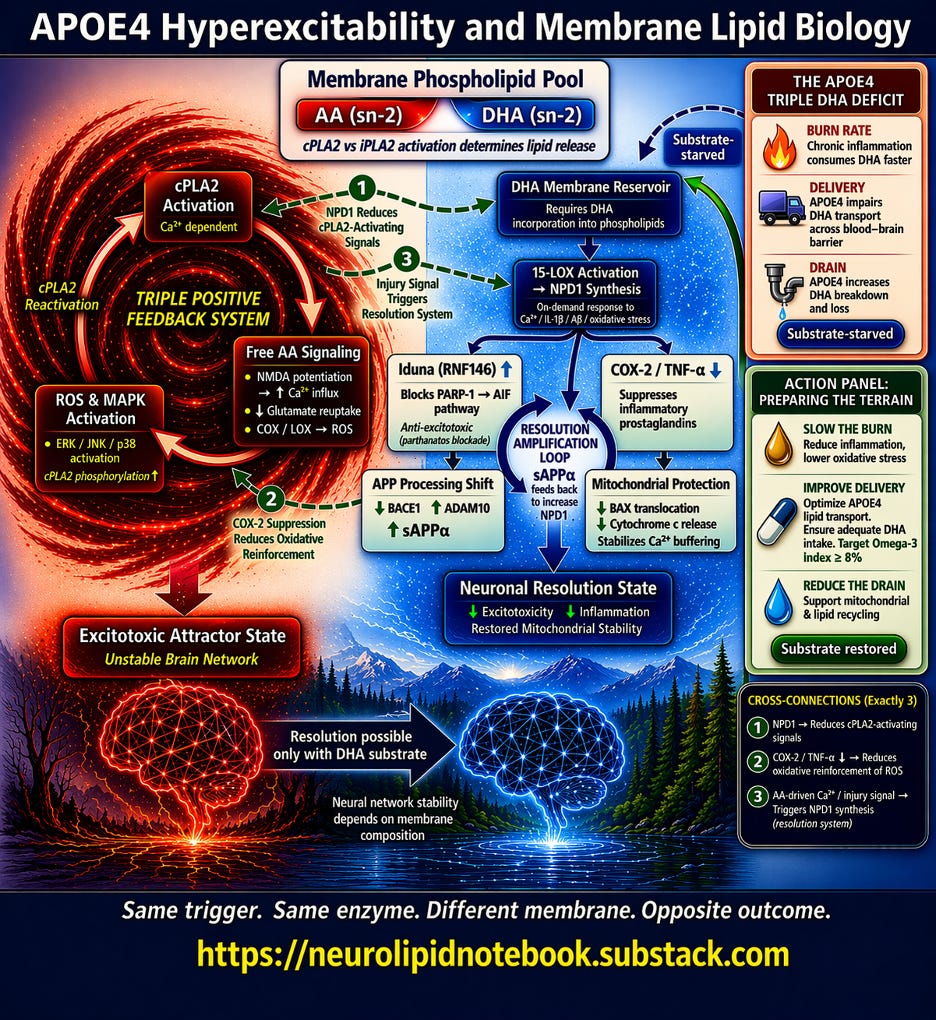
The Vortex diagram above captures a single, high-stakes biological question: when an APOE4 neuron fires and calcium floods in, what happens next? The answer depends entirely on what the cell membrane is made of. This article walks through The Vortex diagram section by section. I am working on a condensed discussion of this for YouTube, for those of you who prefer to view the diagram along while listening rather than reading. Please stay tuned for that.
Start at the Top: The Membrane Phospholipid Pool
The box at the top center is the decision node. Every neuronal membrane contains phospholipids, and each phospholipid carries a fatty acid at a position called sn-2. The two that matter most are arachidonic acid (AA) and docosahexaenoic acid (DHA).
When calcium activates the enzyme cPLA2, it cleaves whatever sits at sn-2 and releases it into the cell. A related enzyme, iPLA2, preferentially releases DHA. The subtitle in the box — "cPLA2 vs iPLA2 activation determines lipid release" — is the first fork in the road.
The diagram splits here. Left = AA-dominant membrane. Right = DHA-enriched membrane. Same trigger, same enzyme — but the membrane composition sends the signal down completely different paths.
The Left Side: The AA Runaway Loop
The red vortex on the left represents what happens when cPLA2 releases arachidonic acid from an AA-dominant membrane. Three nodes form a closed triangular loop:
cPLA2 Activation (top of the triangle) — Calcium-dependent. Every time the neuron fires excessively, calcium activates this enzyme.
Free AA Signaling (middle) — Released AA does three things simultaneously, shown as bullet points inside the box:
- It potentiates NMDA receptors, increasing calcium influx with every subsequent signal
- It impairs glutamate reuptake, so the brain’s main excitatory neurotransmitter lingers longer than it should
- It feeds into COX and LOX enzymes, generating reactive oxygen species (ROS)
ROS MAPK Activation (bottom) — The ROS generated by AA metabolism activate stress kinases (ERK, JNK, p38), which phosphorylate and reactivate cPLA2 — sending the loop back to the top.
The label in the center of the vortex — “TRIPLE POSITIVE FEEDBACK SYSTEM” — is the key message. This is a self-amplifying loop with no internal off switch. More AA releases more calcium, which activates more cPLA2, which releases more AA. Each cycle strips more fatty acid from the membrane and pushes the neuron deeper into instability.
The red arrow at the bottom leads to the outcome: Excitotoxic Attractor State / Unstable Brain Network.
The Right Side: The DHA Resolution Cascade
The blue cascade on the right shows what happens when DHA is available in the membrane. Unlike the left side, this is not a loop — it is a branching cascade that ends in stabilization.
DHA Membrane Reservoir (top) — DHA must first be incorporated into membrane phospholipids. This box includes the note “Requires DHA incorporation into phospholipids” because free-floating DHA in the blood does not help — it must physically be part of the membrane structure.
15-LOX Activation → NPD1 Synthesis (second node) — When stress signals arrive (calcium, inflammatory cytokines, amyloid-beta, oxidative stress), the enzyme 15-lipoxygenase converts membrane DHA into neuroprotectin D1 (NPD1), a specialized pro-resolving lipid mediator. The diagram notes this is an “on-demand response” — the brain synthesizes NPD1 specifically in response to injury, but only if DHA substrate is available.
From NPD1, the diagram branches into four protective arms:
Iduna (RNF146) ↑ — NPD1 upregulates this protein, which blocks the PARP-1 → AIF cell death pathway. This is anti-excitotoxic protection: it intercepts a specific form of neuronal death (parthanatos) triggered by excessive NMDA activation.
COX-2 / TNF-α ↓ — NPD1 directly suppresses the same inflammatory enzymes that AA feeds. By shutting down COX-2, it also reduces the ROS that would otherwise reactivate cPLA2 on the left side.
APP Processing Shift — NPD1 decreases BACE1 (the enzyme that produces toxic amyloid-beta) while increasing ADAM10 (the enzyme that produces protective sAPPα). This is where the Resolution Amplification Loop appears in the diagram: sAPPα feeds back to stimulate further NPD1 synthesis, creating a self-reinforcing resolution cycle.
Mitochondrial Protection — NPD1 prevents pro-death protein translocation to mitochondria, reduces cytochrome c release, and stabilizes calcium buffering — protecting the neuron’s energy supply during stress.
All four arms converge at the bottom: Neuronal Resolution State — decreased excitotoxicity, decreased inflammation, restored mitochondrial stability.
The Three Numbered Cross-Connections
The diagram includes exactly three dashed arrows connecting the two sides. These are not decorative — they represent how the resolution system actively interferes with the runaway loop:
① NPD1 → Reduces cPLA2-Activating Signals. By suppressing ROS and inflammatory signaling, NPD1 removes the MAPK-mediated phosphorylation that keeps cPLA2 running. This is indirect braking — NPD1 does not inhibit cPLA2 directly, but it starves the loop of its reactivation signals.
② COX-2 Suppression → Reduces Oxidative Reinforcement of ROS. By shutting down COX-2 on the right side, NPD1 reduces the ROS that feed back into the left side’s loop. This is how the resolution system reaches across and dampens the vortex.
③ AA-driven Ca²⁺ / Injury Signal → Triggers NPD1 Synthesis. This arrow goes from left to right. The same calcium and oxidative stress that drive the AA cascade also trigger NPD1 synthesis — if DHA is available. This is the biological safety net: the brain is designed to activate resolution in response to injury. But if the membrane lacks DHA, the safety net has no substrate to work with.
The Bridge at the Bottom
Between the two outcome states — Excitotoxic Attractor State (left) and Neuronal Resolution State (right) — sits the bridge arrow labeled "Resolution possible only with DHA substrate." Below it: "Neural network stability depends on membrane composition."
This is the diagram's central thesis in two lines. The resolution system exists in every brain. But it requires raw material. Without DHA in the membrane, the right side of the diagram is structurally present but functionally silent.
Upper Right Inset: The APOE4 Triple DHA Deficit
This panel explains why APOE4 carriers are uniquely vulnerable to DHA depletion. Three rows, each representing a genotype-specific deficit:
Burn Rate — Chronic inflammation consumes DHA faster. Isotope-tracing studies show APOE4 carriers catabolize DHA at roughly four times the rate of non-carriers, with a 77% shorter whole-body half-life. DHA is burned for energy rather than incorporated into membranes.
Delivery — APOE4 impairs DHA transport across the blood-brain barrier. Brain uptake is approximately 24% lower in APOE4 models, even when plasma DHA levels are adequate. DHA accumulates in the blood but fails to reach the brain efficiently.
Drain — APOE4 increases DHA breakdown and loss. The hyperexcitability that APOE4 causes (the left side of the diagram) activates cPLA2 with every calcium surge, stripping membrane fatty acids — including whatever DHA remains.
The dashed arrow from “Substrate-starved” to the DHA Membrane Reservoir shows the compounding effect: less DHA arrives, what arrives is burned faster, and what makes it into membranes is stripped out by the very hyperexcitability APOE4 causes.
The experimental evidence behind this panel: Research from Mélanie Plourde’s laboratory has directly demonstrated that APOE4 mice have 20–30% lower plasma DHA independent of diet, that higher hippocampal AA correlates with worse cognitive performance while higher DHA correlates with better performance, and that a high-DHA diet restores these disturbances. Most recently, Plourde’s group showed that APOE4 carriers, females, and lean individuals show higher EPA concentrations in the phospholipid pool after supplementation — suggesting APOE4 females may have a distinct and potentially favorable lipid response profile.
Lower Right Inset: Action Panel — Preparing the Terrain
This panel maps three modifiable interventions directly onto the three deficits above:
Slow the Burn — Reduce inflammation, lower oxidative stress. Standard supplementation doses may be insufficient for APOE4 carriers due to accelerated catabolism. Higher sustained intake — from dietary sources (fatty fish, fish roe, shellfish) and/or supplementation — may be needed to overcome the burn rate deficit.
Improve Delivery — Optimize APOE4 lipid transport. Ensure adequate DHA intake. The Omega-3 Index (EPA+DHA as a percentage of red blood cell membrane fatty acids) provides a measurable proxy for membrane status. Target: Omega-3 Index ≥ 8%. Baseline testing establishes whether current intake is reaching membranes. Serial testing confirms whether interventions are working. Not depicted due to text limitations: AA:DHA ratio, which will be discussed at the end of this article. Equally if not more important than Omega3 Index.
Reduce the Drain — Support mitochondrial and lipid recycling. Perimenopause introduces estrogen fluctuations that may amplify NMDA-mediated calcium influx in an APOE4 brain already prone to hyperexcitability. Optimizing membrane DHA before this transition may ensure the resolution system has substrate available when calcium-driven cPLA2 activation increases.
Importantly, estrogen is broadly neuroprotective in many contexts. The goal is not to avoid hormone replacement therapy — it is to ensure the membrane environment interprets estrogen’s signal toward resolution rather than excitotoxicity. Estrogen is a signal, not a solution. Prepare the terrain, and estrogen becomes an ally. Ignore it, and the same signal may accelerate the very processes APOE4 carriers need to prevent.
The solid arrow from “Substrate restored” back to the DHA Membrane Reservoir completes the logic: address the three deficits, and the right side of the diagram comes back online.
The Tagline
At the bottom of the diagram:
Same trigger. Same enzyme. Different membrane. Opposite outcome.
One enzyme — cPLA2. Two possible substrates — AA or DHA. Two radically different futures. The membrane composition at the moment of neuronal stress determines which future unfolds. For APOE4 carriers, that composition is not fixed. It is modifiable. And the evidence suggests the window for modification is widest before cognitive symptoms appear.
Overcome the burn rate. Monitor the delivery. Prepare the membrane before the window narrows.
Preparing the Terrain
Preparing the Terrain
Everything above describes a system. What follows is what I believe can be done about it, though this should in no way be seen as individualized medical advice. The NeuroLipid Notebook is written for informational purposes only.
The diagram shows a system whose outcome is determined by the ratio of arachidonic acid to DHA at the membrane. That ratio is not fixed. It can be measured, and it can be changed.
The APOE4 Triple DHA Deficit
APOE4 carriers do not simply have “lower omega-3 levels.” They face a compounding disadvantage across three nodes:
Burn: Chronic inflammation consumes DHA faster. APOE4 carriers exhibit accelerated DHA catabolism — estimated at roughly four times the normal rate of breakdown. The very hyperexcitability described in this diagram drives cPLA2-mediated liberation of DHA from membranes, consuming the substrate the resolution system needs.
Delivery: APOE4 impairs DHA transport across the blood-brain barrier. Brain uptake of DHA is approximately 24% lower in APOE4 versus APOE2 mice, measured by direct radiolabeled perfusion. DHA accumulates in plasma rather than reaching the brain.
Drain: APOE4 mice have 20–30% lower plasma DHA than APOE3 mice on the same diet — not a dietary failure, but a metabolic one. On omega-3-deficient diets, APOE4 carriers show greater tissue depletion across all organs than carriers of other alleles.
Less arrives. What arrives burns faster. What makes it into membranes gets pulled out by the very hyperexcitability it is supposed to resolve.
The critical finding: a high-DHA diet restored the APOE4-specific disturbances in hepatic DHA and arachidonic acid concentrations, suggesting this metabolic disruption is correctable with sufficient intake. The deficit is real, but it is not permanent.
Measuring the Membrane
The Omega-3 Index — EPA plus DHA as a percentage of red blood cell membrane fatty acids — is the most widely available biomarker. A target of ≥8% is associated with lowest cardiovascular and neurological risk. Among those not supplementing and eating fewer than two fish servings per week, only about 2% reach this threshold.
But the Omega-3 Index tells whether omega-3s are present. It does not tell whether the membrane is still dominated by arachidonic acid.
For APOE4 carriers, the more mechanistically relevant metric is the AA:DHA ratio in serum phospholipids — because it captures the competitive balance at the sn-2 position, the exact decision point at the center of this diagram.
In a study of 195 cognitively normal adults, APOE4 carriers who converted to MCI or Alzheimer’s within three years had significantly elevated AA:DHA ratios compared to cognitively stable carriers and noncarriers. Combining this ratio with APOE4 status and amyloid markers achieved 91% accuracy in identifying preclinical disease. Fish oil consumption was associated with lower AA:DHA ratios even among APOE4 carriers.
In the ADCS DHA clinical trial, APOE4/4 homozygotes showed a significantly smaller decrease in AA:DHA ratio in plasma after 18 months of supplementation compared to APOE3/3 carriers — and the change in plasma AA:DHA correlated strongly with the cerebrospinal fluid ratio, confirming it reflects what is happening in the brain compartment.
A falling AA:DHA ratio means the membrane is shifting toward resolution-capable substrate. A stubbornly high ratio, despite supplementation, means the system is not responding — and dose alone will not fix it.
The Same Dose Does Not Produce the Same Result
Plourde’s group showed that APOE4 carriers were lower plasma responders to DHA supplementation — but only in the high-BMI group (BMI ≥25.5). In lean APOE4 carriers, the response was comparable to noncarriers. Sex also independently modulated the response: females showed higher EPA concentrations in plasma phospholipids after supplementation. Body composition is not separate from DHA strategy. It is part of it.
The Estrogen Question
This is where the diagram meets the most consequential decision many APOE4 women face in perimenopause.
Importantly, estrogen is broadly neuroprotective in many contexts; the question is how that signal is interpreted in an APOE4 brain.
Estrogen modulates NMDA receptor function — increasing agonist binding sites in the hippocampus, enhancing calcium transients in dendritic spines, and potentiating excitatory currents. In a brain with adequate DHA, that enhanced signaling supports plasticity. Calcium enters, cPLA2 activates, DHA is released, NPD1 is synthesized, and the system resolves.
In a DHA-depleted, hyperexcitable APOE4 brain — where the left side of this diagram is already looping — that same enhanced signaling adds calcium to a system that cannot resolve it.
The estrogen did not change. The membrane did.
This is not an argument against hormone therapy. It is an argument for sequencing. Optimize the membrane substrate before or concurrent with introducing a signal that will amplify whatever state the membrane is already in.
Prepare the terrain, and estrogen becomes an ally. Ignore it, and the same signal may accelerate the very processes APOE4 carriers need to prevent.
The Omega-3 Index is the starting point. The AA:DHA ratio is the accountability metric. Both should be tracked.
The membrane is not fixed by genotype. It is modifiable. And the window for modification is widest before cognitive symptoms appear.
The diagram I have laid out today is not meant to scare you. For me, it is a decision tool. And the decisions it points to are ones that can be made now — before symptoms, before scans, before the system locks in.
Next in this series: The Drain Diagram. Paid Subscribers, please check your inboxes shortly for your Advanced Copies!
Disclaimer: Nurse Jeannie is an affiliate of Fenix Health Science, US retailer of Lysophasphatidylcholine-bound Omega3 Fatty Acid (Accentrate). If you purchase through the link below, you will support The NeuroLipid Notebook at no additional cost to you. https://www.fenixhealthscience.com/jeanniecapone
She is also an affiliate of OmegaQuant. OmegaQuant provides the most comprehensive, affortable fatty acid tests on the market. “OmegaQuant Complete” is the test that she will be referring to in upcoming articles when referencing the results of her own N=1 experiments. If you are interested in tracking your Omega3’s and Omega6’s in detail, please consider purchasing through the link below. It helps support The NeuroLipid Notebook at no additional cost to you!
https://omegaquant.com/ref/964
"The membrane is not fixed by genotype. It is modifiable. And the window for modification is widest before cognitive symptoms appear."
Nurse Jeannie, Have you read this article? https://pmc.ncbi.nlm.nih.gov/articles/PMC2875212/
Excerpt: In a recent study of the substrate specificities of enzymes and prostanoid receptors, it was found that COX-1 oxygenated EPA with only 10% of the efficiency of AA. It was also found that EPA is a comparatively poor inhibitor of AA oxygenation by COX-2. It can be predicted from these and other observations that decreasing the AA/EPA ratios in phospholipids of human cells will reduce the production of 2-series prostanoids and dampen prostanoid signalling. Because AA competes with EPA and DHA as well as with LA, ALA and oleic acid for incorporation in membrane lipids at the same positions, all these fatty acids are important for controlling the AA concentration in membrane lipids, which in turn determines how much AA can be liberated and become available for prostaglandin biosynthesis following phospholipase activation. Thus, the best strategy for dampening prostanoid overproduction in disease situations would be to reduce the intake of AA, or reduce the intake of AA at the same time as the total intake of competing fatty acids (including oleic acid) is enhanced, rather than enhancing intakes of EPA and DHA only. Enhancement of membrane concentrations of EPA and DHA will not be as efficient as a similar decrease in the AA concentration for avoiding prostanoid overproduction.
To date, no researcher anywhere in the World has done a trial in which intakes of both linoleic acid and arachidonic acid were restricted to levels not significantly in excess of physiological requirements. As noted above, that protocol would be the most efficient way to normalize the Omega-3 index.
While the architecture of metabolic regulation is exquisitely complicated, explaining how it becomes dysregulated is not. For example, "The degree of fatty acid unsaturation of mitochondrial membrane lipids has been found to be one of those biochemical parameters that are most strongly correlated with longevity, when different species of mammals and birds are compared, with a low degree of fatty unsaturation being correlated with less lipid peroxidation and a longer normal life-span." https://pmc.ncbi.nlm.nih.gov/articles/PMC2875212/
Love the 'APOE4 Hyperexcitability and Membrane Lipid Biology' diagram.